
Tracking Shareholder Proposals and Company Exclusions
Glass Lewis is monitoring how the SEC’s new approach to no-action requests is impacting the shareholder proposal landscape
New From Glass Lewis
Next Generation Climate Research for Investors
Forward-looking, financially material insights on how companies are managing their transition risks and opportunities.

AI and the Fiduciary Test
Explore our guide for institutional investors, plus a companion conversation on evaluating AI proxy voting solutions.

The Current Strategic Landscape for Investment Stewardship
An overview of today’s investment stewardship landscape, priorities, and engagement approaches.

Governance and Voting Solutions for Smarter Decisions and Seamless Workflows.

Corporate Governance Solutions to Advance Governance-Related Strategies.


Market Brief: Examining the SEC’s Semiannual Reporting Rule as a Governance Proposal
Market Brief: Examining the SEC’s Semiannual Reporting Rule as a Governance Proposal

Stewardship in Action: Engagement Snapshots on Executive Pay Incentives and Peer Groups
Stewardship in Action: Engagement Snapshots on Executive Pay Incentives and Peer Groups
Tracking Shareholder Proposals and Company Exclusions: Mid-Season Observations
Tracking Shareholder Proposals and Company Exclusions: Mid-Season Observations

Market Brief: What Proxy Voting for Third-Party Tokenized Stocks and ETFs Might Mean for Governance
Market Brief: What Proxy Voting for Third-Party Tokenized Stocks and ETFs Might Mean for Governance
Why Choose Glass Lewis?
Founded in 2003, Glass Lewis operates globally with offices in North America, Europe, and Asia Pacific, including locations in San Francisco, Toronto, London, Limerick, Karlsruhe, Paris, Sydney and Tokyo. Our innovative solutions support governance and stewardship efforts worldwide.

Learn how Glass Lewis supports corporate governance and stewardship best practices.
Book an initial conversation.

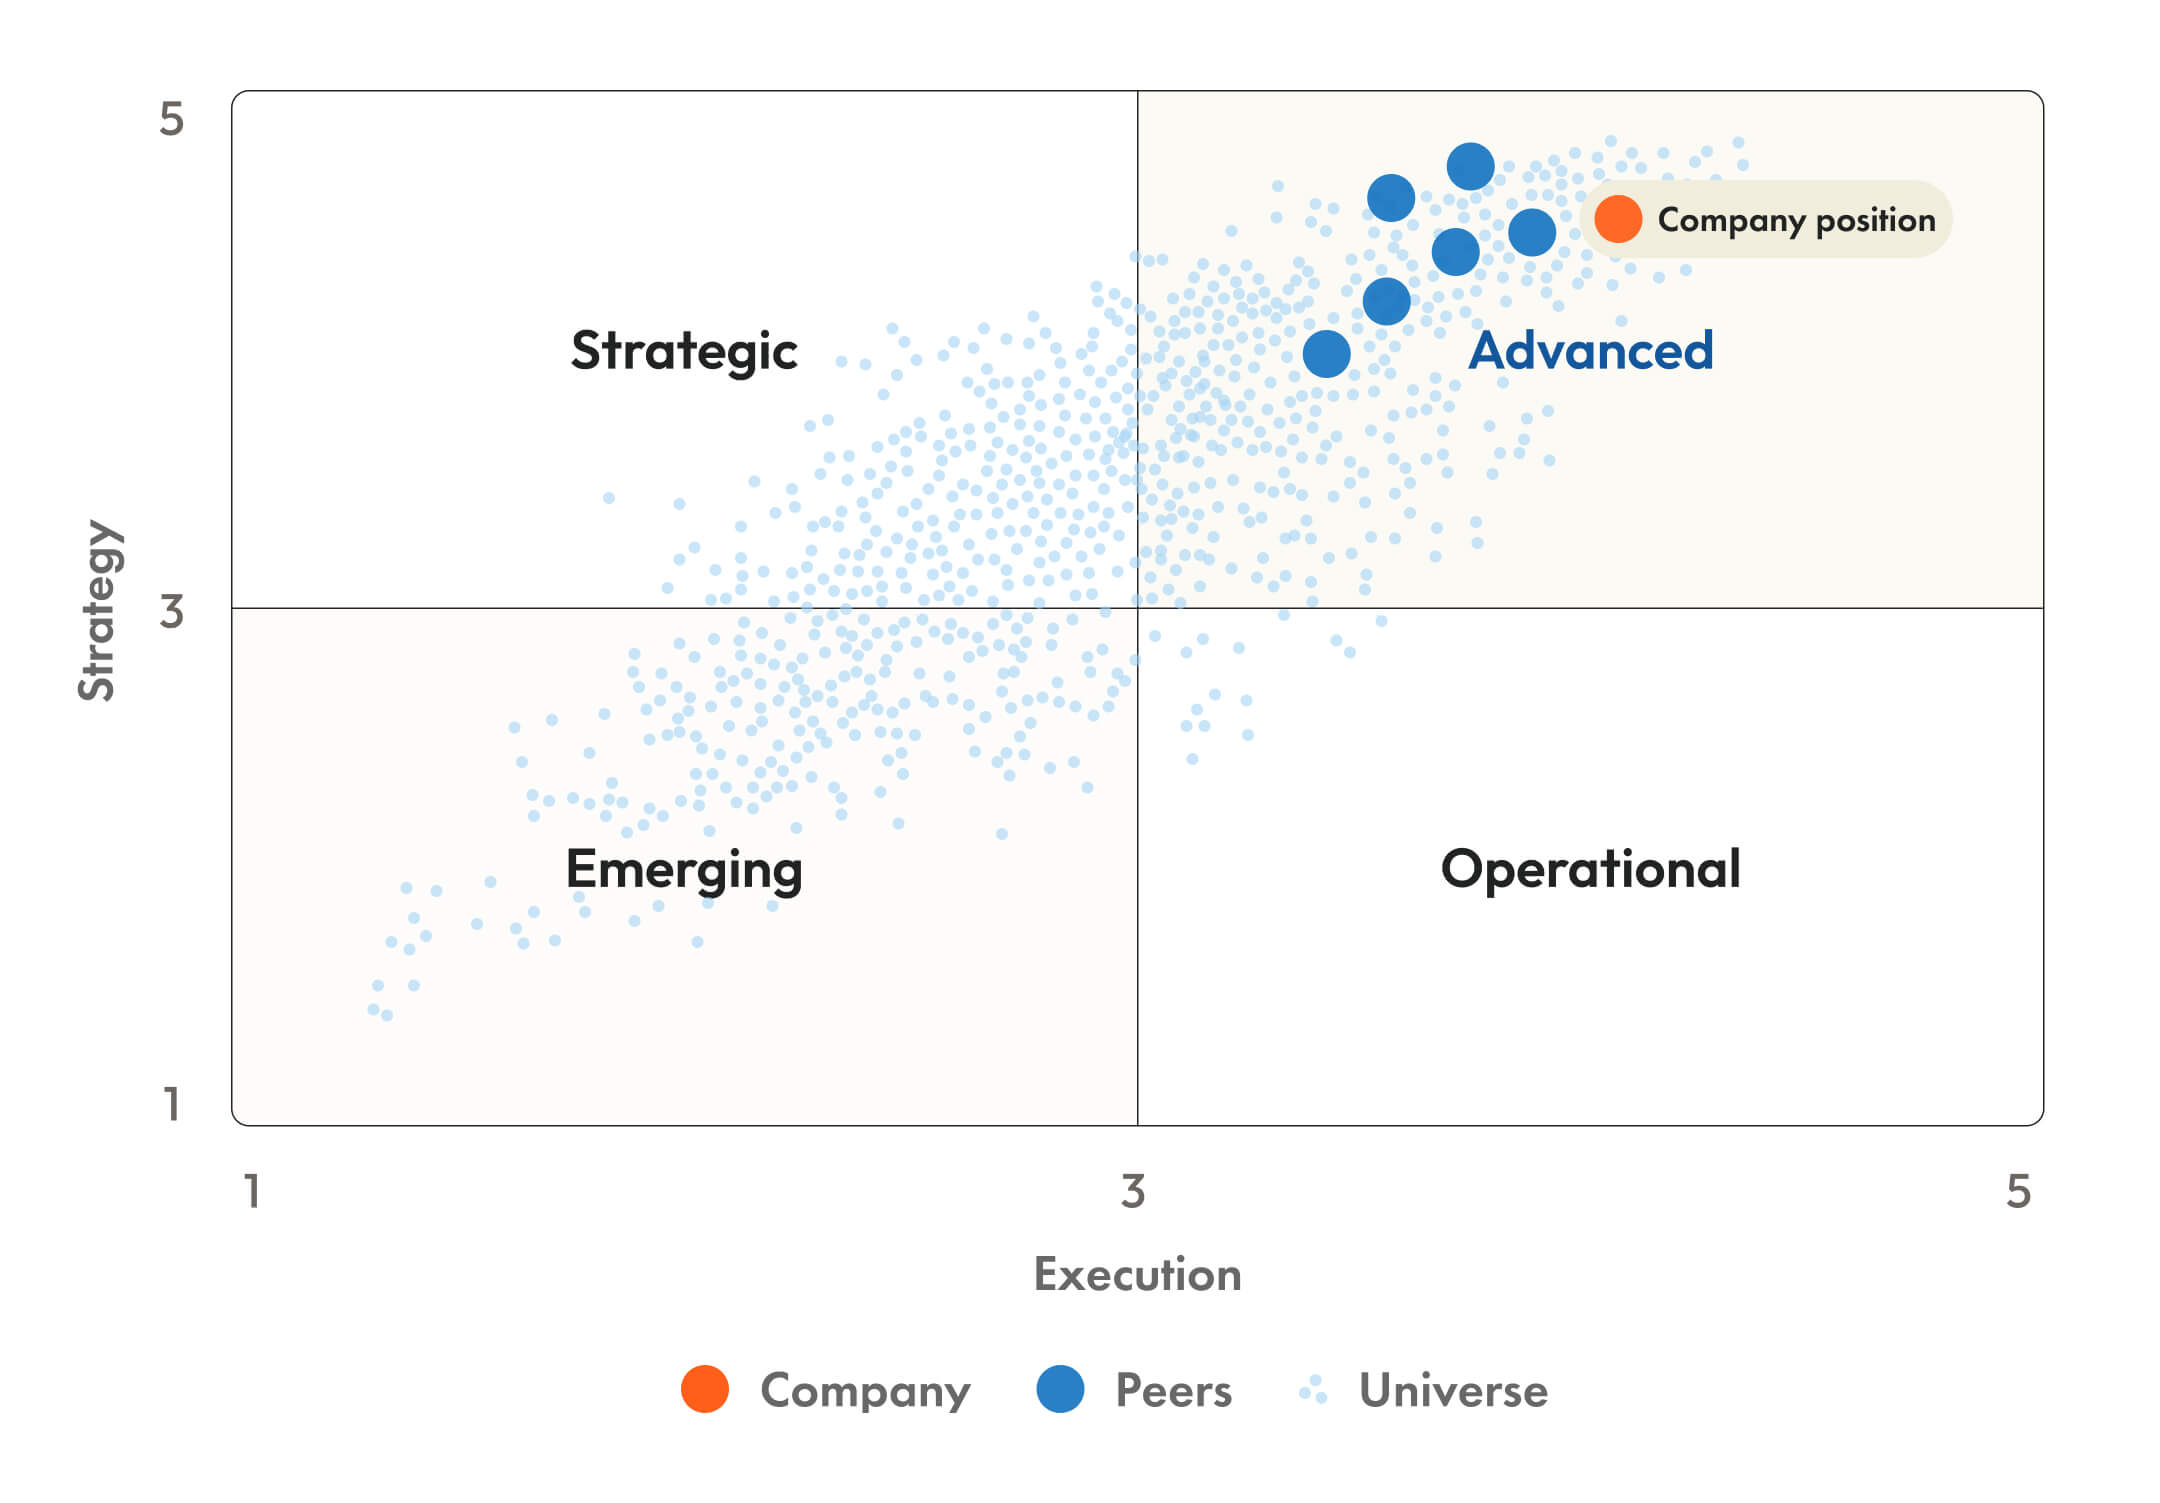
Next Generation Climate Research for Institutional Investors
Forward-looking, financially material insights on how companies are managing their transition risks and opportunities.
Glass Lewis Climate Intelligence helps investors evaluate how companies’ transition strategy and execution drive long-term value.